Appearance
Error Logs
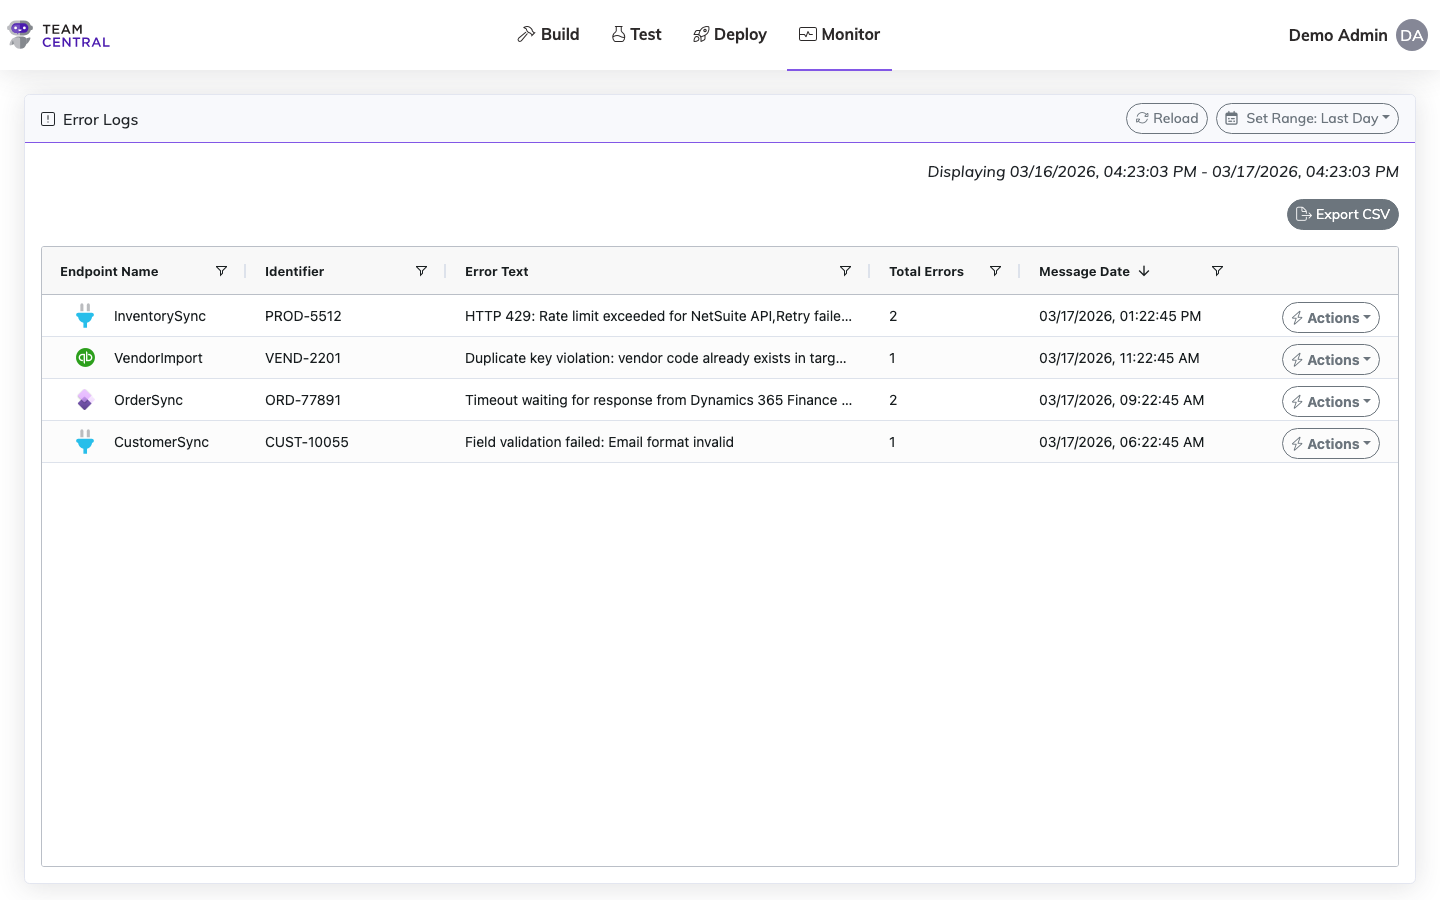
The Error Logs page surfaces processing errors from your integrations. Investigate failures, view error details, and take corrective action.
Key Features
- Error Search — Filter errors by endpoint, date range, and entity type
- Error Details — View full error messages, stack traces, and related log items
- Troubleshooting — Navigate from errors to the related message metadata
Note
Error data can be found via several features, such as Monitor > Messages and Monitor > Error Logs, as well as the Actions > View Details for each instance (row) within these features. For those with advanced skills, error messages can also be found within the code view.
View and Manage Error Logs
- Select Monitor > Error Logs.
- Then, use the table below to determine the next steps.
| To | Do this |
|---|---|
| View the data | All transaction data will be displayed in the table. |
| Refresh the data | Select Reload. |
| View a specific time range | Select Set Range. Select a pre-formulated timeframe (e.g. Last Hour) or select Custom to apply a specific date and time. Select Apply. |
| Re-run the message | Select Actions > Re-Run Message in the appropriate row. |
| View message details | Select Actions > View Details in the appropriate row. A Message Details window will appear; select a tab to view additional information: Message (code view), Receipts (subscribers and error log data), Outputs (file download links if applicable), and Re-Run History (audit of previous re-runs). Select Cancel to close and return to the previous screen. |
| View record history | Select Actions > View Record History in the appropriate row. The record history for that error will open in a new browser tab, displaying all messages associated with that record, including all activity and errors with timestamps. From this screen, you can select Actions > Re-Run Message or Actions > View Details. |
WARNING
The Re-Run Message option should be used only if you understand the error and believe it has already been fixed in the triggering system.
TIP
It is advised to view the message details, which provides an opportunity to analyze the error details and formulate a fix; however, as needed, you can also select to Re-Run the message from the details view.
Viewing record history is a good way to find out if the error has already been resolved. For example, if an error happened when syncing a sales order at 8 PM, but was successful when it ran again at 9 PM, both messages would appear in the history.
Error Log Reference Table
Use the table below to better understand the data available in the Error Logs.
TIP
Hover over and select the filter icon or sort arrow in any column header to narrow your search. The filters will vary based on that column's data. You can apply filters to one or multiple columns, as needed.
| Column | Description |
|---|---|
| Endpoint Name | The system that triggered the message. |
| Identifier | The unique identifier for that record in the system that triggered the message. |
| Error Text | Error message details. |
| Total Errors | The number of error messages within the set date range. |
| Message Date | The date and time stamp that message occurred. |
| Actions | Enables users to Re-Run Message, View Details, and View Record History. |
Example
If you find that the Identifier with the Message Search error shows 3186, and the Endpoint Name shows it was generated by NetSuite, then you can go to your NetSuite application to view record 3186 to gather additional information.
Related Pages
- Messages — Inspect individual integration messages
- Monitor Dashboard — View platform health at a glance
- Alerts — Configure automated error notifications