Appearance
Monitor Dashboard
The Monitor Dashboard provides an at-a-glance view of your integration platform's health and activity. View message processing metrics, trends over time, and publisher endpoint statuses.
Key Features
- Message Metrics — View total published, processed, successful, and errored messages by endpoint
- Time-Based Charts — Track processing trends over the last hour, day, week, or month
- Publisher Status — Monitor the health and last run time of each publisher endpoint
View the Dashboard
- Select Monitor > Dashboard from the main menu.
- Then, use the table below to determine the next steps.
| To | Do this |
|---|---|
| View data in graph format | Select the graph icon. |
| View data in table format | Select the table icon. |
| Reload | Select Reload to refresh the data. |
| Set a specific date range | Select Set Range. Select a pre-formulated timeframe (e.g. Last Hour) or select Custom to apply a specific date and time. Select Apply. By default, the system will show data for the Last Day. |
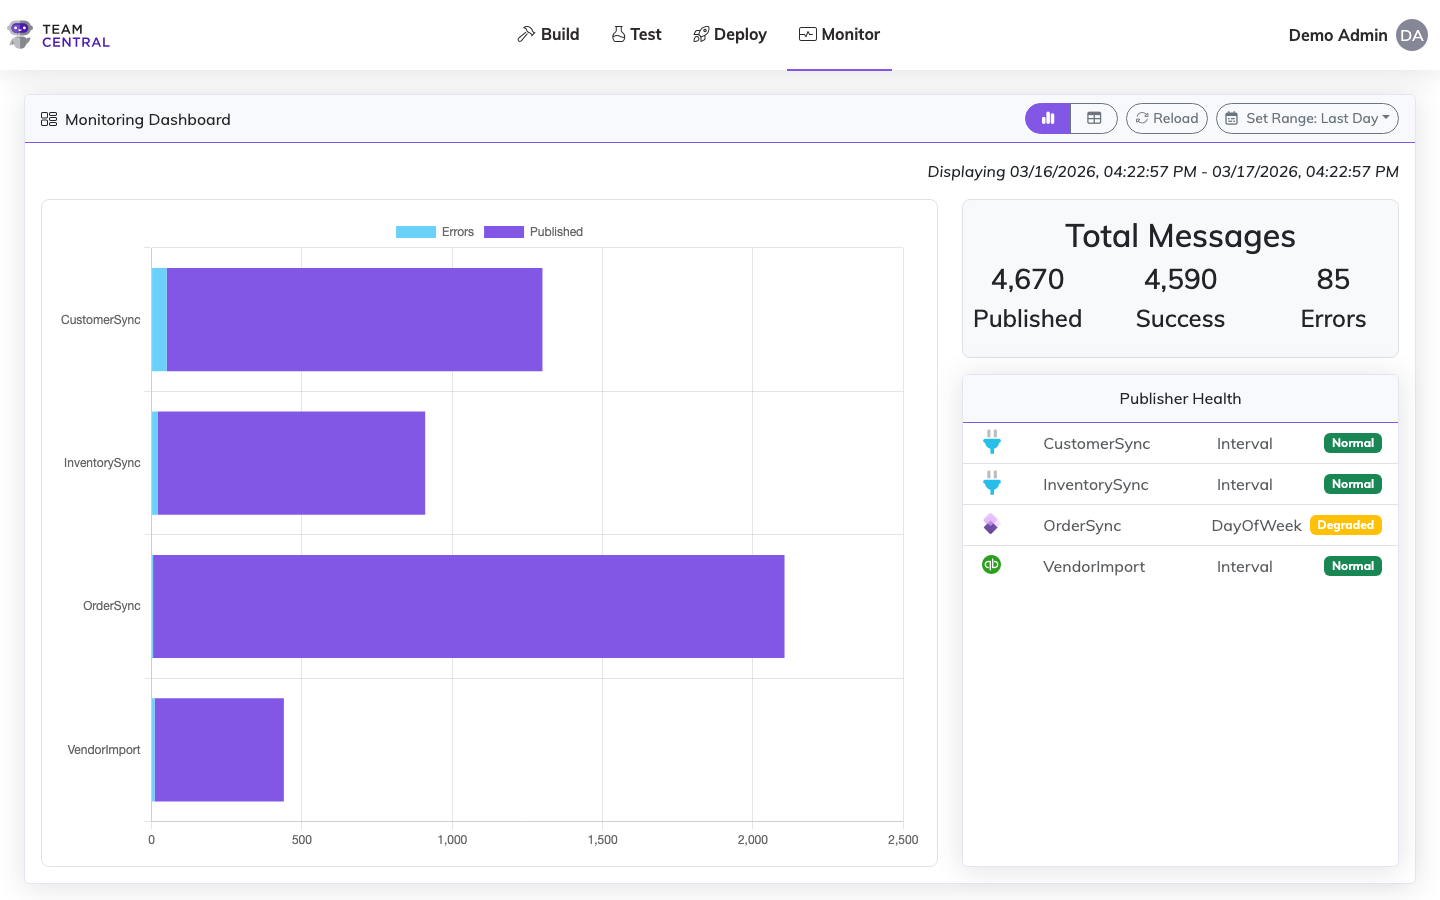
Graph View Dashboard
The Graph View provides a visual depiction of system activity across your Data Hubs.
| Section | Description |
|---|---|
| Monitoring Dashboard | Visual depiction of the systems' errors and published messages for the given date range. |
| Total Messages | A quantified depiction of the total published and successful messages, as well as errors. |
| Publisher Health | Easily visible indication of each system's health at the Endpoint level. Select any system to view the Messages for that Endpoint. |
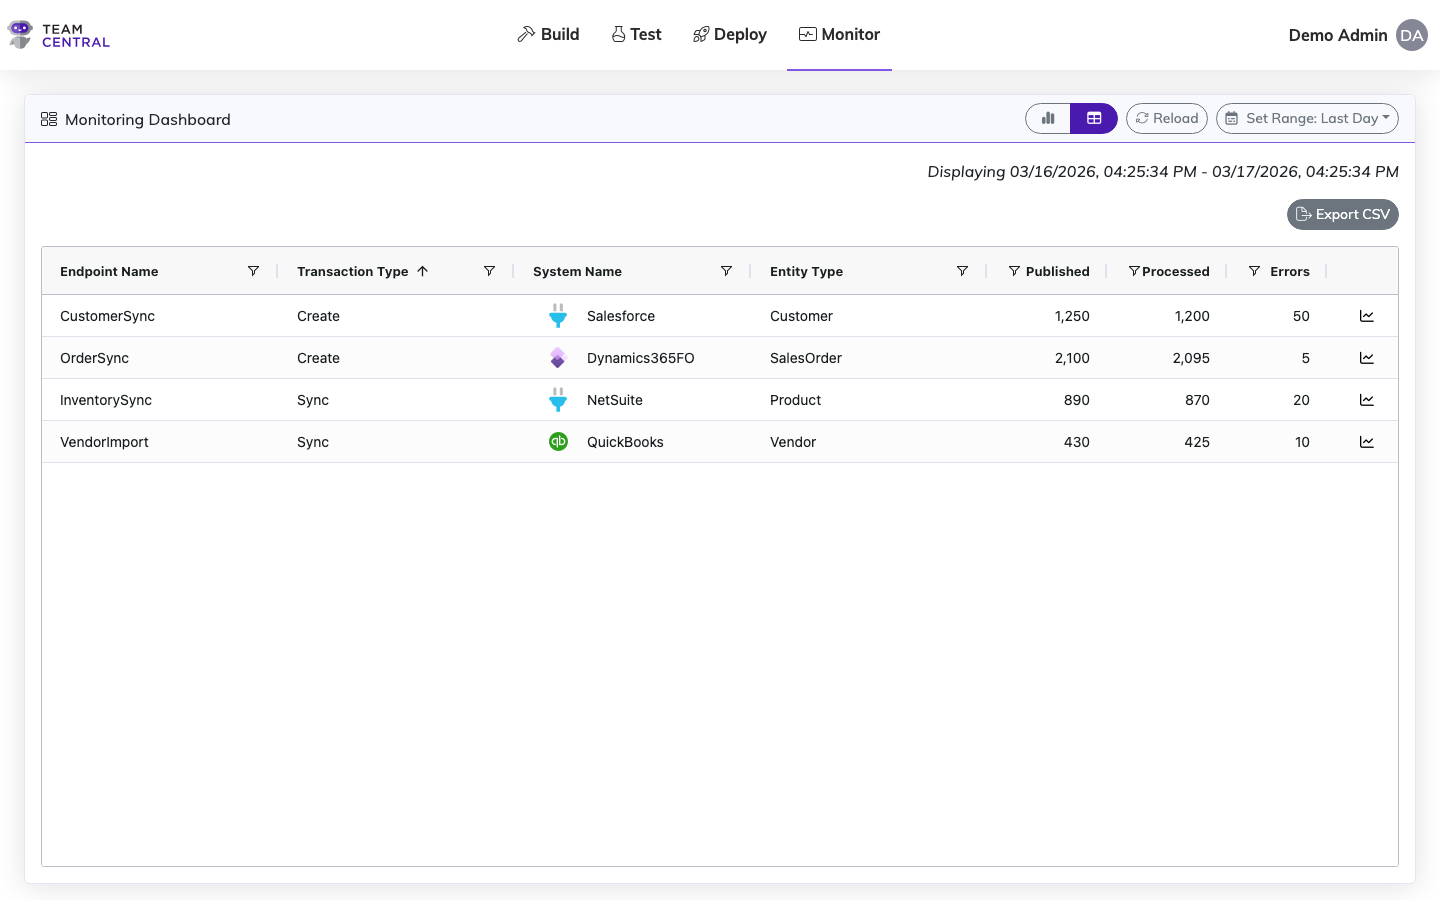
Table View Dashboard
The Table View provides a granular, tabular breakdown of message activity per endpoint.
TIP
Select the filter icon or sort arrow in any column header to narrow your search. The filters will vary based on that column's data. You can apply filters to one or multiple columns.
Select the graph icon in the final column of any row to view that specific Endpoint's data in a visual format.
| Column | Description |
|---|---|
| Endpoint Name | The data is being published to this Data Hub Endpoint, which you established when creating the Data Hub. |
| Transaction Type | Describes the logical grouping of the type of data event being transcribed, e.g. Save Employee Data, Save Invoice. This is the trigger point for data publishing, while the Entity Type refers to the type of data that it's tied to on the Common Model. |
| System Name | The Connector system publishing that data within that Data Hub Endpoint. |
| Entity Type | The type of data represented in the payload of the message, referencing the type of data that it's tied to on the Common Model. This field directly ties back to the Data Model. |
| Published | The number of data messages published within the set date range. |
| Processed | The number of data messages processed within the set date range. |
| Errors | The number of error messages that occurred within the set date range. |
Related Pages
- Messages — Inspect individual integration messages
- Error Logs — Investigate processing errors
- Publisher Logs — Review publisher run history
- Alerts — Configure automated error notifications